The short answer
LED strip lights do not have one fixed electricity consumption. Energy use depends on watts per meter, the number of meters operating at the same time, hours of use, dimming state and losses in the driver or control system. LED count alone cannot answer the question.
For a first estimate, multiply the strip’s rated watts per meter by the active length. Then convert the result to kilowatt-hours using the daily operating schedule. If the system uses an AC-to-DC driver, include its efficiency or measure the complete system at the wall.
The U.S. Department of Energy explains that lighting efficiency should be compared as light output per unit of input power, usually lumens per watt, rather than by wattage alone. Its commercial LED purchasing guidance also warns against over-lighting a space. A lower-watt strip is not a saving if the design then needs more meters or runs at full output to meet the same task.
How to calculate LED strip electricity use
Start with three separate values.
1. Strip load in watts
Strip load (W) = rated W/m × active meters
Use the rating for the exact model and operating state. For RGB, RGBW or tunable-white products, confirm whether the published value represents one channel, a normal scene or the maximum permitted channel combination.
2. Estimated wall input
For a low-voltage system with an AC-to-DC driver:
Estimated wall input (W) = strip and controller load ÷ driver efficiency
Driver efficiency is not universal and can change with model, input voltage, load and temperature. As one real reference, the current Mean Well PWM-120 specification lists different typical efficiencies for its 12V, 24V, 36V and 48V versions. Use the proposed driver’s data at the relevant operating point; do not copy a percentage from another model.
For an AC220V driver-free strip, measure or use the declared AC input power of the complete rectifier-and-strip set. Do not add a separate driver-efficiency assumption that is not part of that construction.
3. Energy in kilowatt-hours
Monthly energy (kWh) = wall input (W) ÷ 1,000 × hours per day × operating days
Monthly electricity cost = monthly kWh × local tariff per kWh
Use the customer’s actual tariff and currency. Commercial tariffs may include time-of-use rates, demand charges or taxes that a simple kWh calculation does not capture.
Worked examples
Example A: one 10m COB run
Our catalog includes an 8mm COB 320 LED/m CRI95 strip rated at 12W/m. Treat the following as a calculation example, not a promise about the wall input of an unselected driver.
- Strip load: 12W/m × 10m = 120W
- Assumed driver efficiency for the example: 90%
- Estimated wall input: 120W ÷ 0.90 = 133.3W
- Schedule: 8 hours per day for 30 days
- Monthly energy: 133.3W ÷ 1,000 × 8 × 30 = about 32.0kWh
Multiply 32.0kWh by the applicable local tariff. Replace the assumed efficiency with the selected driver’s value or a measured input before using the result in a budget.
Example B: a hotel with 80 identical room sections
Suppose each room has 6m of a 10W/m strip and the average schedule is 5 hours per day.
- DC strip load per room: 60W
- Total DC strip load: 60W × 80 rooms = 4,800W
- Monthly strip-side energy before driver losses: 4.8kW × 5 hours × 30 days = 720kWh
The wall-side figure will be higher because drivers and controls consume power. Occupancy schedules can reduce actual hours, but only if the controls are commissioned and used as planned. Separate emergency, corridor and continuously powered loads instead of applying one average to the entire property.
Example C: compare two quotations correctly
One quotation offers 8W/m and another 12W/m. The 8W/m option is not automatically 33% cheaper to operate. Ask for the delivered lumens, optical distribution, diffuser loss, required spacing and maintained light level in the actual assembly. The project may need different lengths or dimming levels to produce the same result.
What changes actual consumption?
Rated power tolerance and voltage
Confirm the permitted input-voltage range and power tolerance. A bench sample powered above its nominal voltage can draw more power and run hotter. Do not raise driver voltage to compensate for a dim far end; correct the voltage-drop and feed-point design.
Driver loading and efficiency
A driver selected only by maximum wattage may operate inefficiently at a very light load. Check its efficiency curve, minimum load where applicable, temperature derating and standby consumption. Splitting a project into sensible zones can improve control and maintenance, but every additional driver or controller may add standby load.
Dimming and scene selection
Dimming usually reduces strip power, but wall input may not fall in exact proportion to the displayed percentage. The driver and controller still consume power, and dimming curves are not always linear. For a scheduled project, test the exact dimmable LED strip system at the scenes that will actually be used.
RGB, RGBW and tunable white
Different channel combinations draw different current. A decorative color scene may use less than full white, while some tunable-white products limit simultaneous channel output. Record the maximum permitted state and the normal programmed scene separately.
Optical losses and over-lighting
Frosted covers, deep coves and indirect surfaces can reduce delivered light. That can be a worthwhile trade for comfort and uniformity, but it belongs in the energy comparison. Specify the required visual result first, then compare complete systems at that result.
Operating schedule and standby
For retail, hospitality and facade work, hours often matter more than a small difference in W/m. Count cleaning, merchandising, overnight, holiday and commissioning hours. Measure controllers, gateways and drivers when they remain energized with the strip off.
How to measure a representative installation
A calculation is useful for planning; a production-intent sample gives the buyer a better forecast.
- Record the exact strip, driver, controller, connector and cable models.
- Install the planned length on the intended profile or mounting surface. Fully unroll every sample before full-power operation.
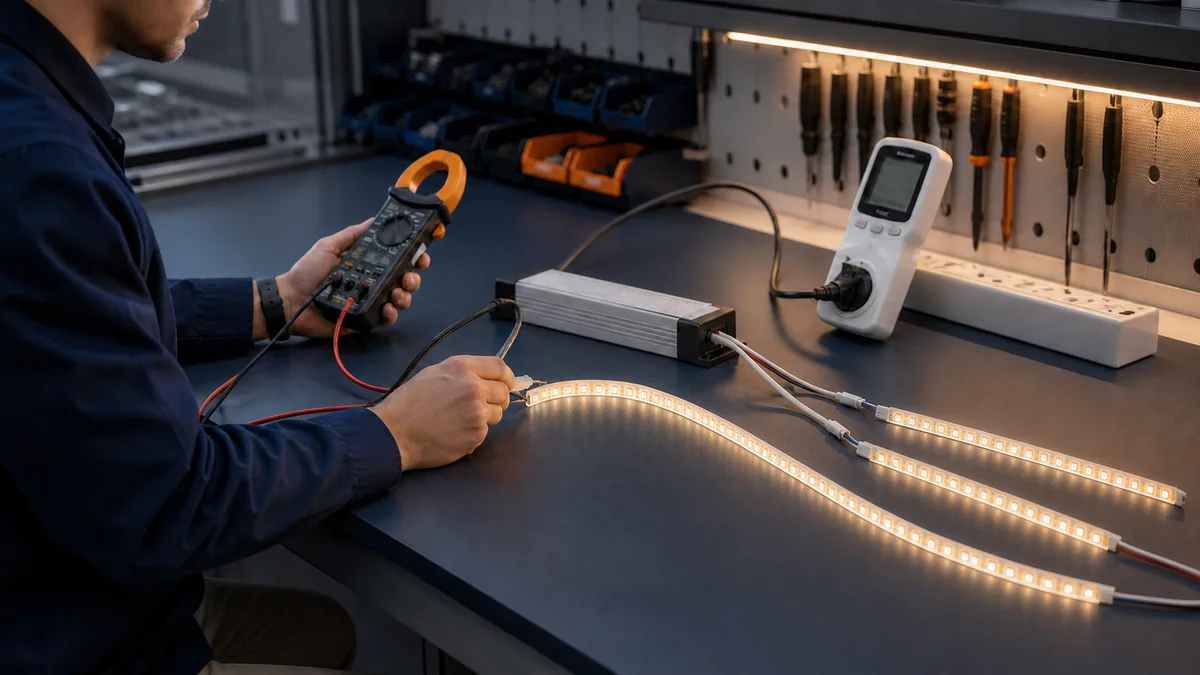
- Measure AC input power with a suitable true-power meter at the normal supply voltage.
- Record full output, each required scene, the normal dimmed level and standby.
- Operate the assembly until electrical and thermal readings stabilize.
- Repeat at the longest planned cable route and powered length.
- Apply the real daily schedule to each measured state.
- Retain the approved component list so production substitutions do not invalidate the estimate.
A clamp meter showing current alone may not provide true watts on an AC driver. Use equipment that measures real input power and power factor where those values matter.
Energy-use checklist for an RFQ
- exact strip model, voltage and rated W/m;
- active meters per branch and total installed meters;
- maximum and normal control states;
- driver and controller models with efficiency and standby data;
- daily hours, operating days and control schedule;
- required delivered light level and optical assembly;
- cable routes, feed points and allowable voltage drop;
- ambient temperature and driver enclosure;
- wall-input measurement method for the approval sample;
- local tariff and whether the budget needs demand or time-of-use charges.
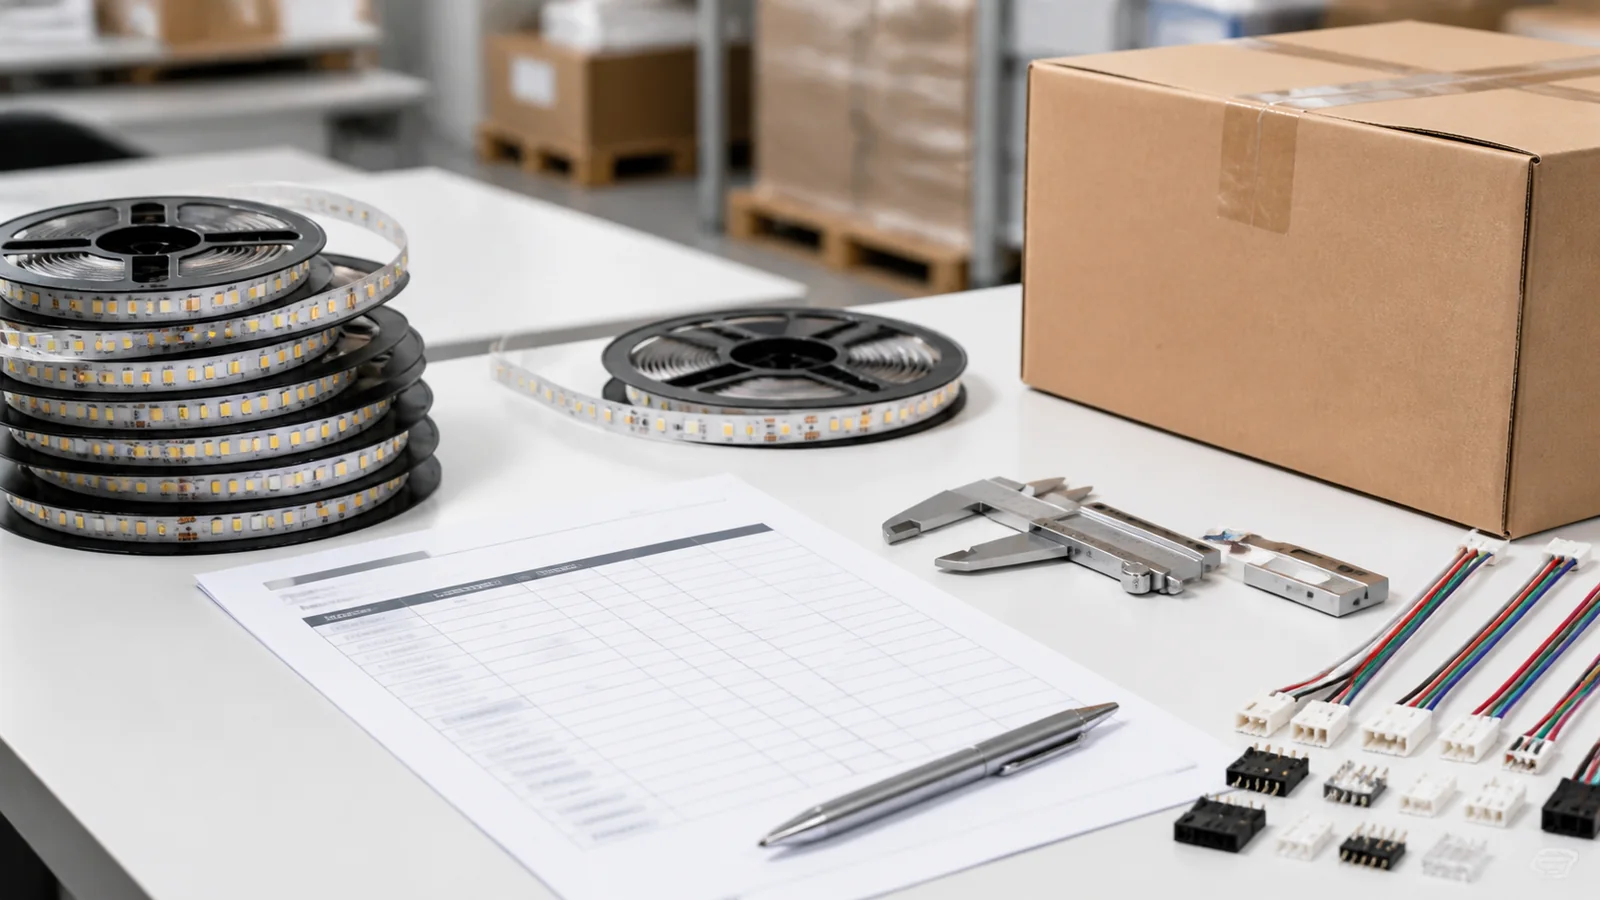
For a bulk quotation, send the room, shelf or facade schedule instead of only the total meters. We can match it to the current 12V/24V range or other catalog models, but final energy use depends on the approved strip, driver, controls and operating plan.
Catalog & Sourcing Note
This article is prepared from our current product catalog and B2B specification workflow. Electrical, waterproofing and installation requirements vary by model and market, so confirm the final specification and approved sample before ordering.
Discuss Your Specification